NeuroLogic: Fundamentals
EEG Fundamentals
Mastering EEG Fundamentals
Explore the core principles of electrophysiology and master the International 10-20 system for electrode placement. This comprehensive module combines technical theory with interactive practical tools.
How EEG Sees the Brain
When you observe an EEG trace, you are not reading the direct "all-or-nothing" firing of individual axonal action potentials. Due to their brief duration (1 millisecond) and random spatial orientations, action potentials cancel each other out. Instead, scalp EEG measures the collective, synchronized summation of extracellular voltage fluctuations driven by Postsynaptic Potentials (PSPs).
These PSPs are transient, graded potential shifts occurring at the dendrites and soma of cortical neurons. Individually, a single postsynaptic potential is microscopic (~0.1–2 mV). However, when thousands of aligned neurons undergo postsynaptic changes simultaneously, their individual electrical fields summate, projecting a detectable signal through the meninges, cerebrospinal fluid, skull, and scalp.
Imagine a stadium containing 60,000 spectators. If each fan talks randomly, the result is chaotic background "white noise." However, if a Conductor (the Thalamus) pacing circuit coordinates them to clap in unison, the sound surges into a rhythmic roar. This is synchronization.
Scalp detection generally requires synchronous activation across several square centimeters of cortex; often-cited experimental estimates begin around 6 cm², but detectability varies with source depth, orientation, synchrony, amplitude, and background activity. Volume conduction through CSF, skull, and scalp attenuates and spatially blurs cortical potentials.
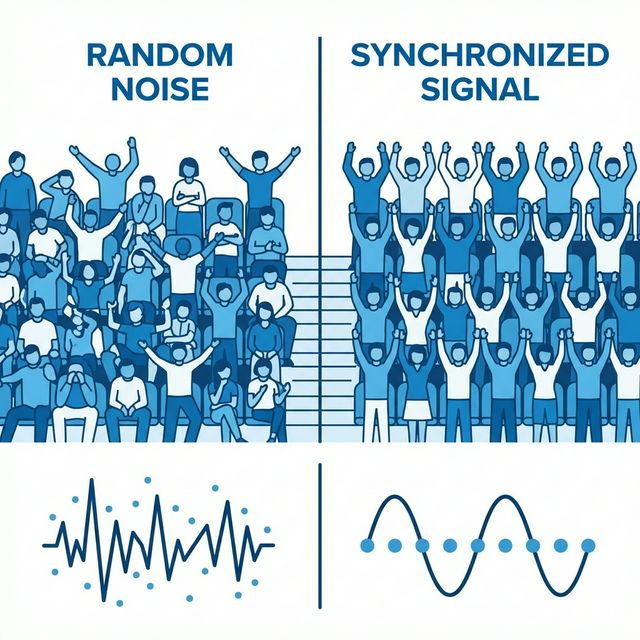
Extracellular potentials must summate synchronously across populations to overcome tissue impedance.
Bioelectric Batteries & Open Fields
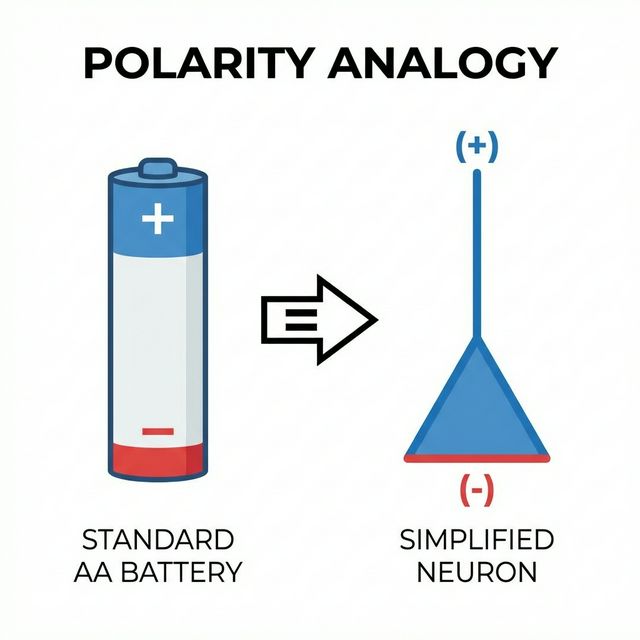
Similarly oriented cortical pyramidal neurons can form open fields whose synchronized postsynaptic currents contribute to scalp EEG.
Routine scalp EEG mainly reflects synchronized postsynaptic transmembrane currents in populations of similarly oriented cortical pyramidal neurons. Visibility at the scalp depends on synchrony, spatial extent, depth, orientation, tissue conductivity, montage, and background activity.
1. The "Open Field" Geometry
Pyramidal cells are often aligned approximately perpendicular to the local cortical surface, allowing synchronous currents to sum as an open field. More symmetric cellular arrangements tend to cancel at a distance and contribute less to scalp EEG; “open” and “closed” are useful models, not an absolute visible/invisible divide.
2. Extracellular Sinks and Sources
In a simplified example, inward positive current at an apical dendrite creates a local extracellular sink, while distributed return current forms extracellular sources elsewhere. Their spatial separation produces a current dipole. Real cortical generators combine excitatory and inhibitory currents at different cellular locations, so scalp polarity cannot be translated directly into “excitation” or “inhibition.”
Generating the Waveform: Polarity Rules
The table below is a simplified radial-dipole model. It illustrates how current location and direction can reverse local surface polarity. Actual scalp deflection also depends on dipole orientation, volume conduction, reference choice, and montage; an upward or downward wave does not identify a neurotransmitter or prove excitation versus inhibition.
| Synaptic Event Type | Cortical Location | Simplified Local Surface Polarity | EEG Deflection (Clinical Standard) |
|---|---|---|---|
| Excitatory (EPSP) | Superficial (Apical) | Negative (-) [Sink] | Upward Deflection (Negative is UP) |
| Excitatory (EPSP) | Deep (Soma/Basal) | Positive (+) [Source] | Downward Deflection |
| Inhibitory (IPSP) | Superficial (Apical) | Positive (+) [Source] | Downward Deflection |
| Inhibitory (IPSP) | Deep (Soma/Basal) | Negative (-) [Sink] | Upward Deflection (Negative is UP) |
Display convention: Clinical EEG is conventionally displayed with a relative negative input upward and a relative positive input downward. This describes a channel's voltage difference—not an absolute voltage at one electrode and not a direct readout of neuronal excitation.
Dipole Orientation: Radial vs. Tangential
The orientation of the dipole relative to the scalp surface determines whether and where a signal will be detected by scalp electrodes:
Radial Dipoles (Gyri)
Located near a gyral crown and oriented approximately perpendicular to the local skull surface. Their scalp field is often maximal near the overlying region, although volume conduction and individual anatomy limit precise cortical localization.
Tangential Dipoles (Sulci)
Located deep within a sulcular wall, parallel to the scalp. They project their positive and negative charges sideways. This can create a "paradoxical" field where maximum negativity is recorded at a distance, or they may cancel out entirely, making them a major clinical blind spot.
Solid Angle Theory: The voltage recorded on the scalp is proportional to the solid angle subtended by the active generator. Deep generators or tangentially oriented sources inside a sulcus require much wider cortical synchronization (larger surface area) to produce a readable trace than superficial, radially oriented gyrus sources.
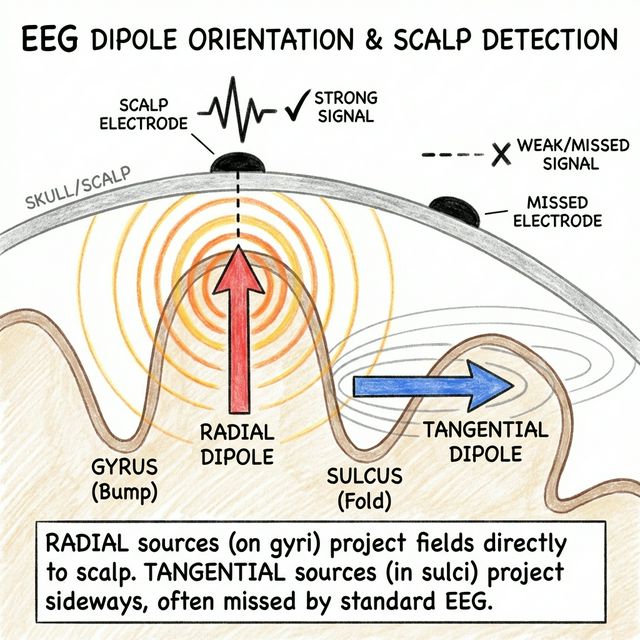
Radial sources project directly upward. Tangential sources project sideways, often showing a complex dipole fields.
The 10-20 System: A Global Map
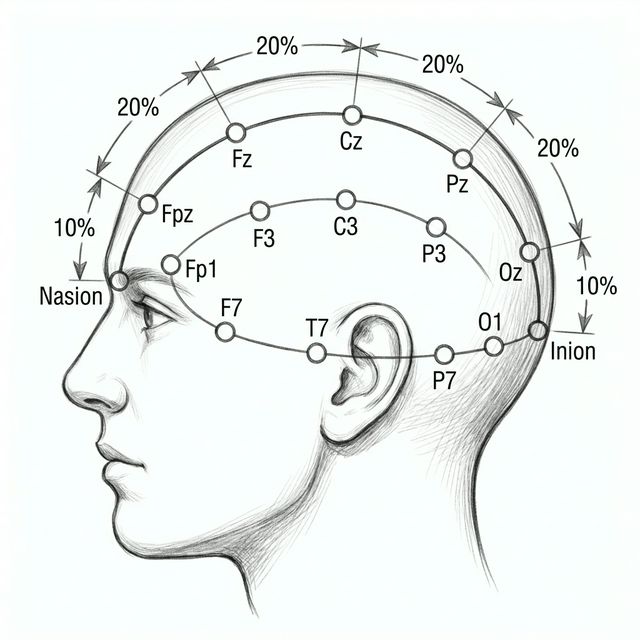
Consistency is key. The International 10-20 System uses percentages (10% and 20%) of measured scalp distances to place electrodes reproducibly across different head sizes. C3 and C4 lie near the left and right sensorimotor regions, but a scalp coordinate does not guarantee an exact cortical structure in every individual.
- Letters: F (Frontal), T (Temporal), C (Central), P (Parietal), O (Occipital).
- Numbers: Odd (Left), Even (Right), z (Midline).
- Impedance Check: Ordinarily kept at ≤ 5 kΩ and reasonably balanced, while following the equipment manufacturer and local laboratory protocol.
Side View (Profile)
Top View
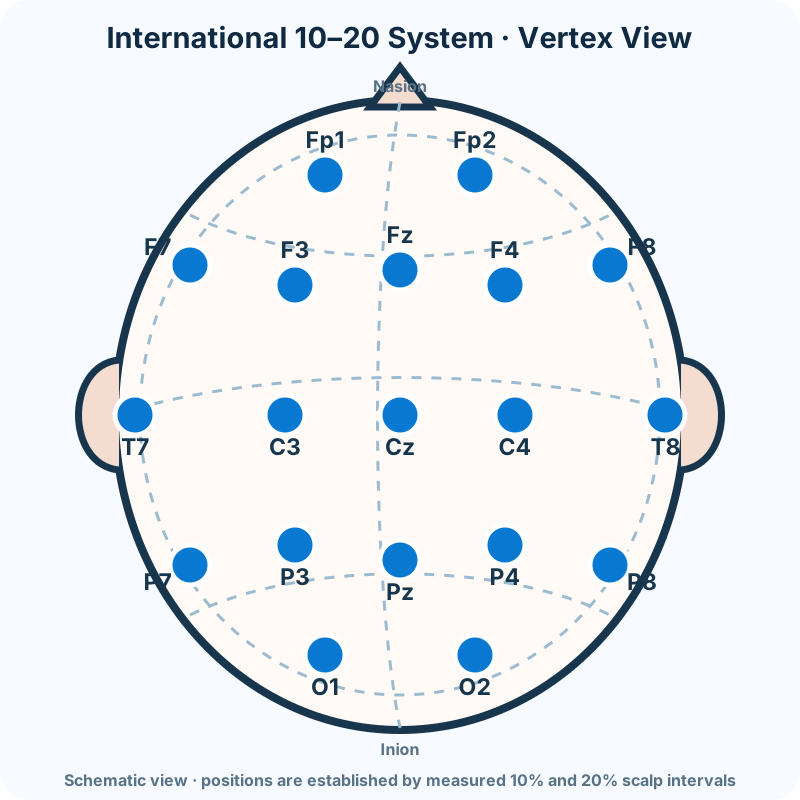
The 10-20 Anatomical Map
EEG electrode placement is not arbitrary. The International 10-20 System uses anatomical head measurements to ensure reproducibility. Electrodes are placed at 10% and 20% intervals along perpendicular cranial arcs between four key bony landmarks:
- Nasion: The deep depression at the bridge of the nose, directly between the eyes.
- Inion: The prominent bony ridge at the base of the occipital skull (external occipital protuberance).
- Left & Right Preauricular Points: The depressions just anterior to the tragus of each ear.
Understanding the Electrode Codes:
- Letters represent underlying cerebral zones: Fp (Frontopolar), F (Frontal), T (Temporal), P (Posterior), O (Occipital).
- Central (C) is a virtual zone: Note that Central (C) is not an anatomical lobe; it represents the central sulcus and motor-sensory strip territory.
- Midline "Zero" (z) Code: The "z" in Fz, Cz, Pz, and Oz stands for Zero (representing the midline), not "zone."
- Hemisphere Codes: Odd numbers (Fp1, F3, T7) designate the Left hemisphere. Even numbers (Fp2, F4, T8) designate the Right hemisphere.
- Reference & Ground: Historically, A1/A2 represent earlobe (Auricular) targets. Modern systems often use M1/M2 representing the bony mastoid processes behind the ears.
Impedance check: Scalp electrode–skin impedances should be checked before recording and rechecked when artifact is suspected. ACNS guidance states that impedance ordinarily should not exceed 5 kΩ; balanced contacts and the specifications of the recording system also matter.
The Grid: Understanding Bipolar and Referential Logic
A single electrode on the scalp cannot record an electrical potential. It has no value until it is compared to another point. This comparison (Input 1 minus Input 2) is executed by a differential amplifier.
An EEG montage is a logical display of differential channels. The longitudinal bipolar ("double banana") montage is an essential standard display, but no single montage is sufficient for every pattern. Clinical review uses complementary bipolar and referential displays and preserves the ability to reformat digitally.
Common Mode Rejection (CMR): Differential amplifiers automatically reject signals that affect both inputs equally (like 60Hz ambient hum) and amplify only the difference between Input 1 and Input 2. This isolates micro-volt brain rhythms from mega-volt environmental static.
Bipolar Logic: The Phase Reversal
In a Bipolar Montage, adjacent electrodes are linked sequentially in a chain (e.g., Channel 1: Fp1-F3, Channel 2: F3-C3). Each channel subtracts its second input from its first input.
Channel Output = Input 1 Voltage - Input 2 Voltage
If Input 1 is −50 μV and Input 2 is −20 μV:
(−50 μV) − (−20 μV) = −30 μV (Upward Deflection due to Negative-is-Up).
Epileptogenic Phase Reversals:
When a focal cortical discharge (e.g., a negative spike) occurs directly under an electrode (e.g., F3), it becomes the most negative point in the surrounding chain:
- Channel 1 (Fp1-F3): F3 is Input 2. Since Input 2 is negative, the subtraction formula outputs a positive value (Fp1 − F3 = 0 − (−100) = +100 μV). This projects Down (Divergence).
- Channel 2 (F3-C3): F3 is Input 1. Since Input 1 is negative, the formula outputs a negative value (F3 − C3 = (−100) − 0 = −100 μV). This projects Up (Convergence).
This creates a Converging Phase Reversal where the channel waveforms point toward each other, "kissing" at the point of maximum negativity (the spike focus). Conversely, a positive discharge (e.g., positive spikes or sharp transients of sleep) creates a Diverging Phase Reversal where waveforms point away from each other.
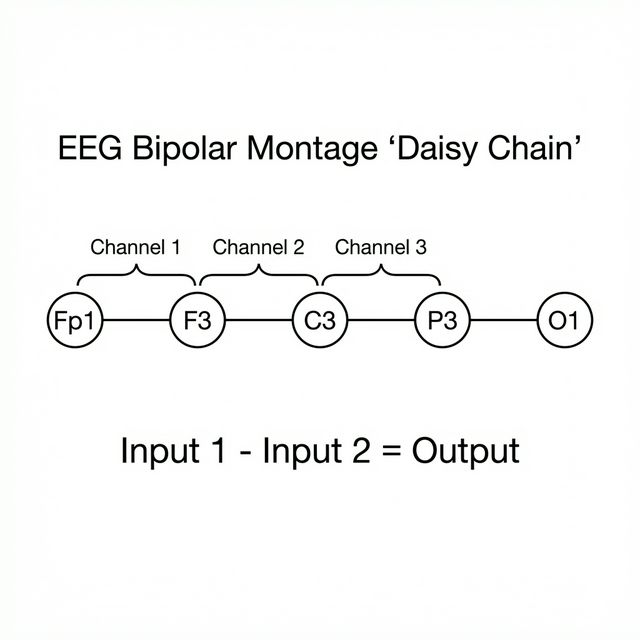
Sequential bipolar chains create a localizing grid. Opposing deflections pinpoint the discharge focus.
Scalp View
Channel 1: Fp1 - F3
Channel 2: F3 - C3
Referential Power & Common Average Reference (CAR)
While Bipolar montages are excellent for localizing sharp transients via phase reversals, they can falsely depress amplitude or completely miss broad, generalized discharges that span across multiple channels (since Input 1 and Input 2 would have identical voltage, subtracting to zero).
In a referential montage, each active scalp electrode is compared with a shared reference. A common average reference (CAR) is one useful computed option, not a universally superior standard:
- Mathematical Average: CAR sums the potentials of all active scalp electrodes (e.g., 21 electrodes) and divides by the total number, creating a computed baseline reference.
- Amplitude and field distribution: The largest deflection helps identify the scalp maximum of a field, but source orientation, depth, reference composition, and volume conduction prevent a simple one-to-one equation between amplitude and generator proximity.
- Reference Contamination Warning: If a single electrode suffers a massive artifact (e.g., a loose electrode or localized muscle spike), that high voltage is mathematically distributed into the common average, causing a "paradoxical" ghost artifact to appear across every other channel.
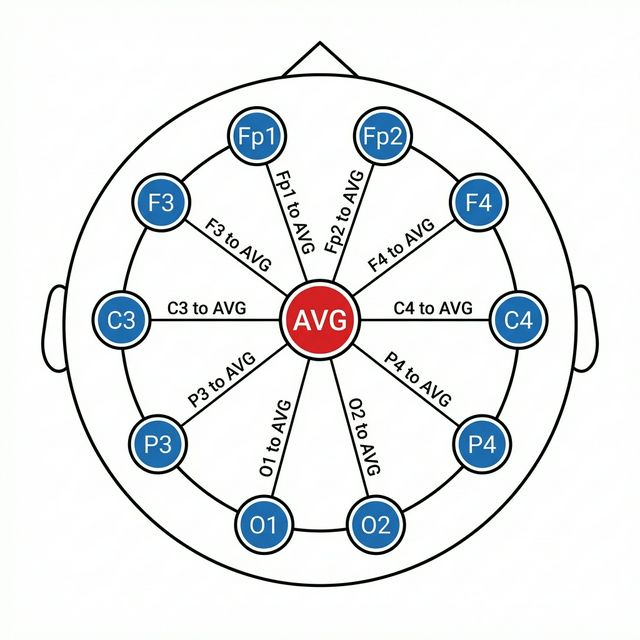
Common Average Reference (CAR) maps actual voltage amplitudes relative to the global average of the entire head.
Vertex & Circle Layouts
Transverse (Coronal)
Electrodes are linked left-to-right (e.g., T7-C3-Cz-C4-T8). Ideal for detecting midline vertex spikes (maximal at Cz) which often cancel out or remain invisible on standard longitudinal front-to-back chains.
Circumferential (Halo)
Chains encircle the outer boundaries of the head. Useful for localizing spikes that arise at "end of chain" electrodes (such as Fp1/Fp2 or O1/O2) which lack neighbors to compare against in longitudinal grids.
Instrument Parameters: Filters & Sensitivity
Acquisition Filters (LFF/HFF): LFF (High-Pass) removes slow sweat/breathing drift. HFF (Low-Pass) attenuates myogenic EMG muscle buzz.
LFF 0.5 Hz = 0.3s TC. High LFF (5.0 Hz) or low HFF (15 Hz) blunt wave peaks, which can obscure critical diagnostic transients.
Sensitivity (Calibration Scale): Governs visual wave height magnification. Standard baseline is 7 μV/mm.
At standard 7 μV/mm, a 70 μV spike will measure exactly 10 mm tall.
High display sensitivity (2 μV/mm) may be used when a protocol specifically evaluates electrocerebral inactivity. EEG alone does not establish brain death/death by neurologic criteria under the current U.S. consensus guideline; follow the applicable examination, apnea-testing, ancillary-testing, and local-policy requirements. Lower display sensitivity (15-20 μV/mm) can help display high-amplitude activity without channel overlap.
EEG: A Language of its Own
In clinical practice, we interpret the raw trace by reading its structured "vocabulary." Two foundational descriptors are frequency (cycles per second, measured in hertz) and amplitude (the displayed voltage difference, measured in microvolts).
Think of waveforms as the "words" of EEG. Just as a sentence contains nouns, verbs, and punctuation, an EEG study combines background rhythms, physiological sleep transients, benign lookalikes, and pathological epileptiform discharges.
Frequency: The Four Primary Bands
Frequency classification is the baseline step of EEG analysis. Normal adult waking activity represents a harmonic balance across these four primary physiological frequency bands:
Delta (0.5 – 4.0 Hz)
The slowest conventional band. Delta is expected in N3 sleep and is prominent at younger developmental ages. In an awake adult, persistent focal delta suggests focal cerebral dysfunction and may accompany a structural lesion; generalized delta can accompany diffuse dysfunction, medication effects, or reduced arousal and must be interpreted in clinical context.
Theta (4.0 – 8.0 Hz)
Common during normal drowsiness in adults and in normal awake children. Pathologically, it indicates mild-to-moderate diffuse cerebral dysfunction or focal subcortical structural injury.
Alpha (8.0 – 13.0 Hz)
The hallmark of the normal, awake, relaxed brain. It forms the Posterior Dominant Rhythm (PDR), located over the occipital regions. Differentiable by its dynamic Reactivity: it emerges instantly upon eye closure and disappears (attenuates) with eye opening or mental concentration.
Beta (> 13.0 Hz, typically 13–30 Hz)
Fast, low-amplitude activity, maximal in the frontal-central regions. Promoted heavily by anxiety, active visual attention, and the use of sedative-hypnotic medications (such as benzodiazepines or barbiturates).
Background reactivity: The posterior dominant rhythm normally attenuates with eye opening. Reactivity is interpreted alongside state, medications, technique, and the rest of the recording; absent or reduced reactivity can be concerning but is not diagnostic in isolation.
Visualizing Frequencies
Delta: 3 Hz (Slow & High Amplitude)
Theta: 5 Hz (Intermediate)
Alpha: 9 Hz (Normal Awake PDR)
Beta: 15 Hz (Fast & Low Amplitude)
The Biophysical Inverse Law: Natural brain rhythms follow an inverse relationship: Lower Frequency = Higher Voltage (Amplitude), and Higher Frequency = Lower Voltage. Excursions from this rule (e.g., high-voltage fast Beta activity) often indicate drug effects or pathological cortical irritation.
Sleep Architecture: Diagnostic Graphoelements
Sleep is a dynamic neurophysiological process. Differentiating sleep stages is critical, as many sleep waveforms mimic epilepsy spikes, and certain epilepsy syndromes manifest exclusively during NREM sleep transitions.
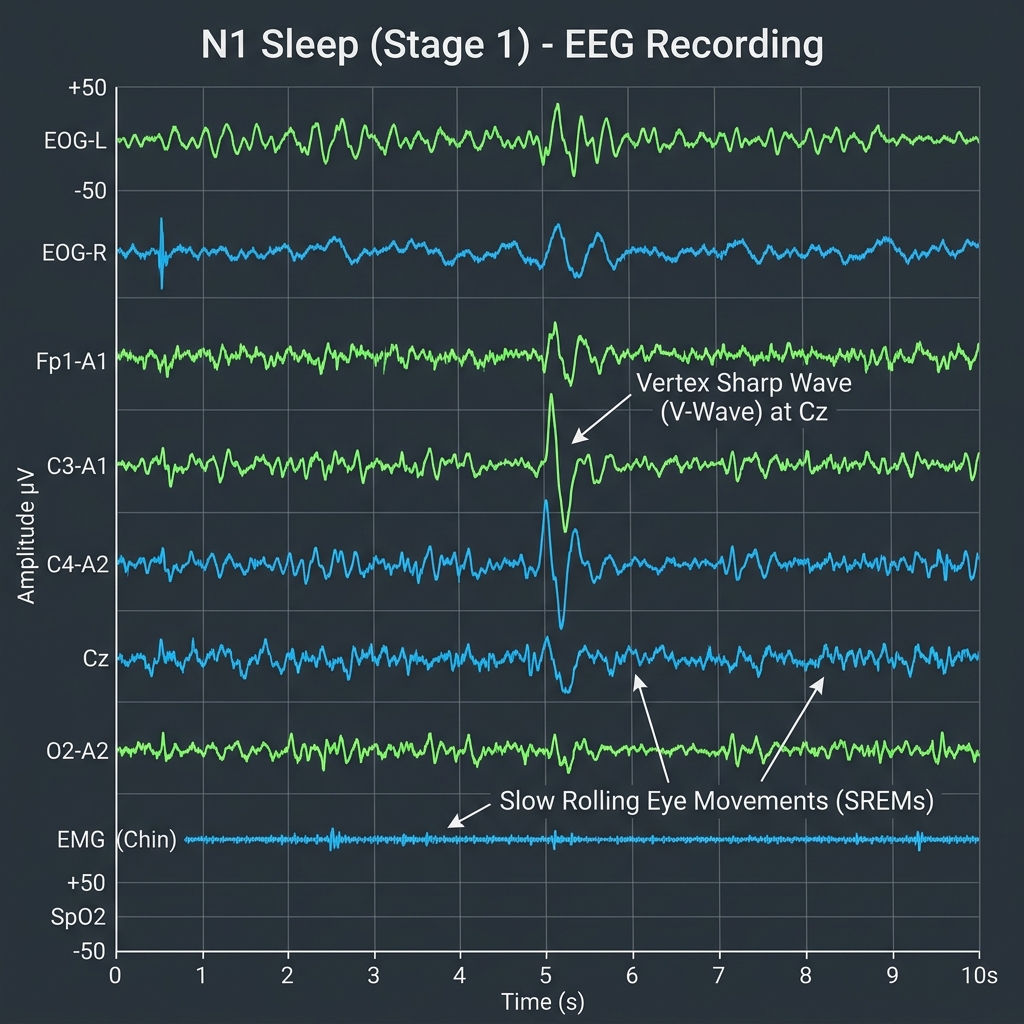
Stage N1 (Light Sleep)
Drowsiness. The occipital PDR disappears and is replaced by low-voltage, mixed-frequency theta activity. Differentiated by:
• Vertex Sharp Waves (V-waves): Brief, sharp, negative transients maximal at the midline central region (Cz).
• Slow Rolling Eye Movements (SREMs): Gentle, slow horizontal oscillations.
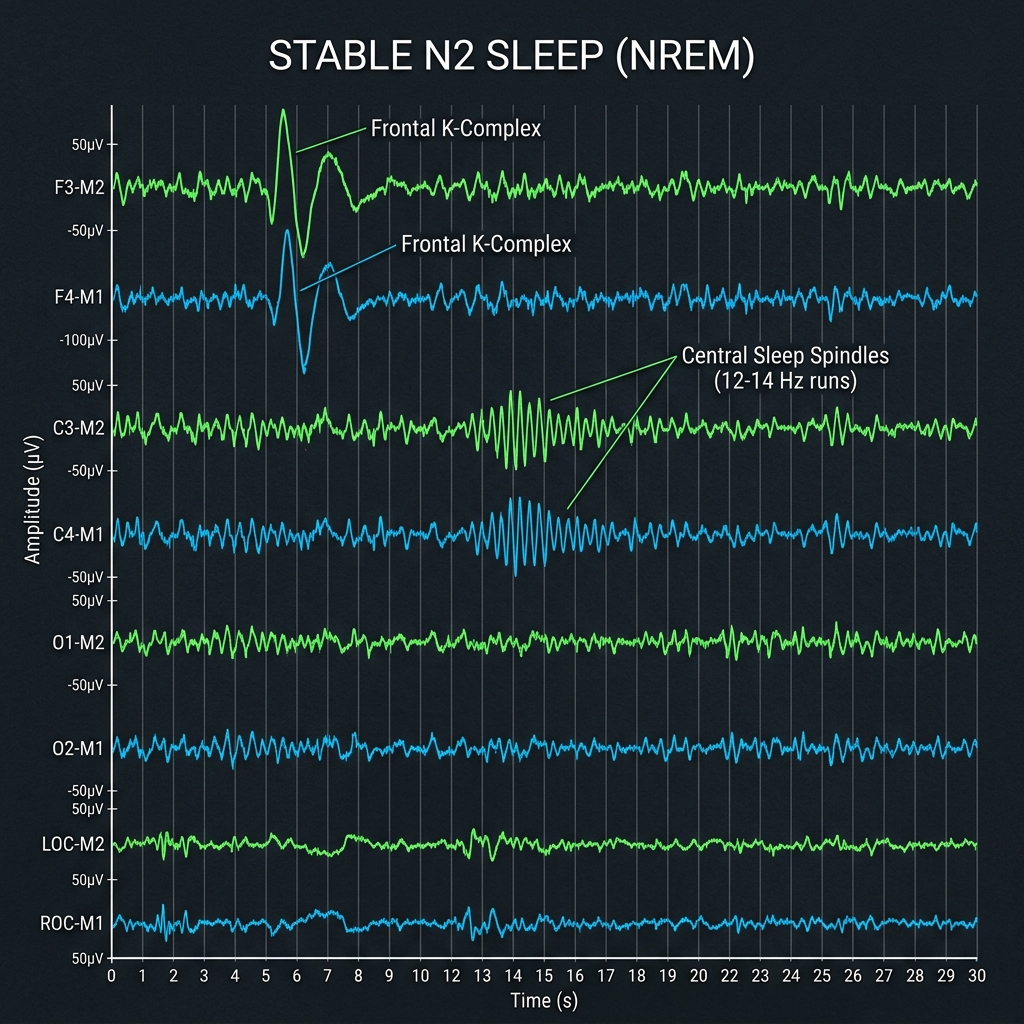
Stage N2 (Stable Sleep)
Differentiated by two distinct, diagnostic waveforms:
• Sleep Spindles: Rhythmic sinusoidal runs of 11–16 Hz (classically 12–14 Hz) activity lasting >0.5 seconds, maximal in central/frontal channels.
• K-Complexes: High-voltage, biphasic sharp waves (negative then positive) lasting >0.5 seconds, maximal at the midline, often elicited by sound stimuli.
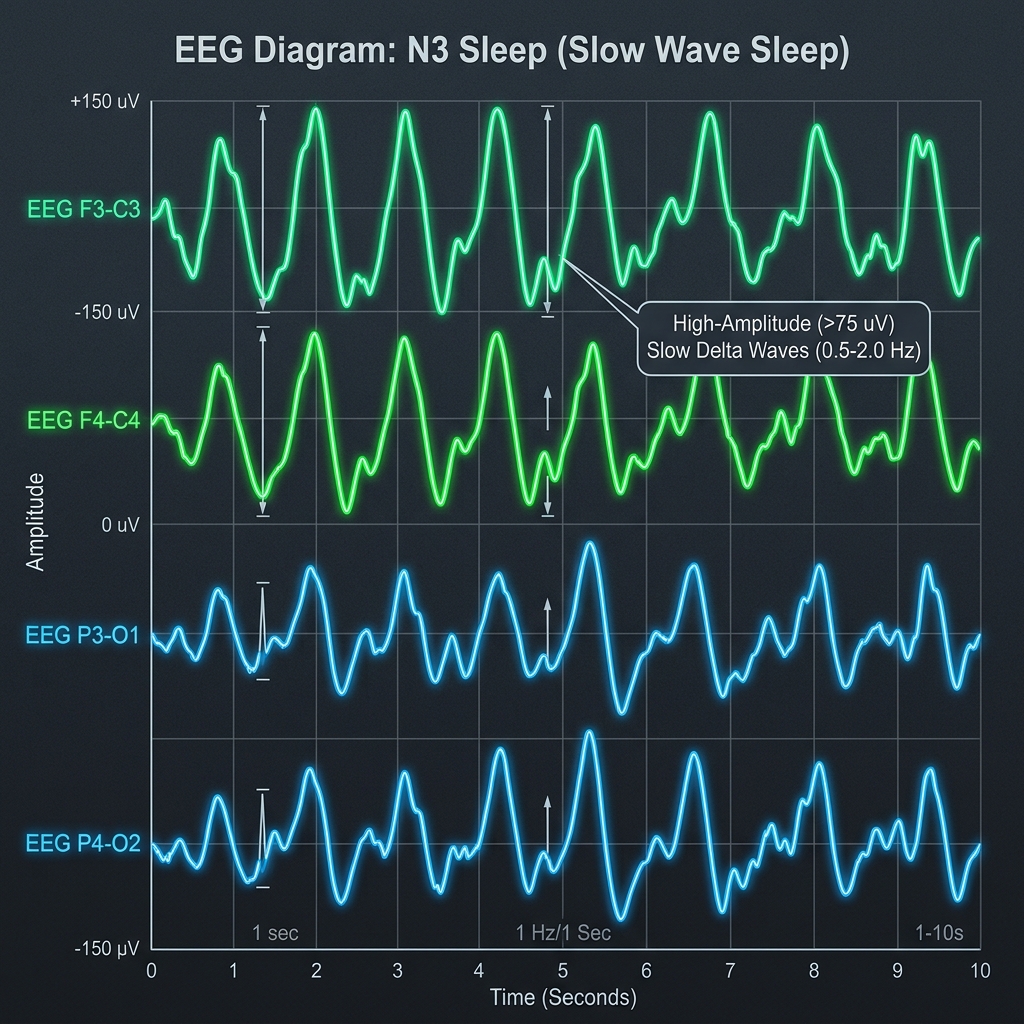
Stage N3 (Slow Wave Sleep)
Deep NREM sleep. In adults, N3 is scored when slow-wave activity at 0.5–2 Hz and at least 75 μV measured over the frontal derivations occupies at least 20% of a 30-second epoch. Other activity may still be present; spindles can occur and are not scored separately from the N3 epoch.
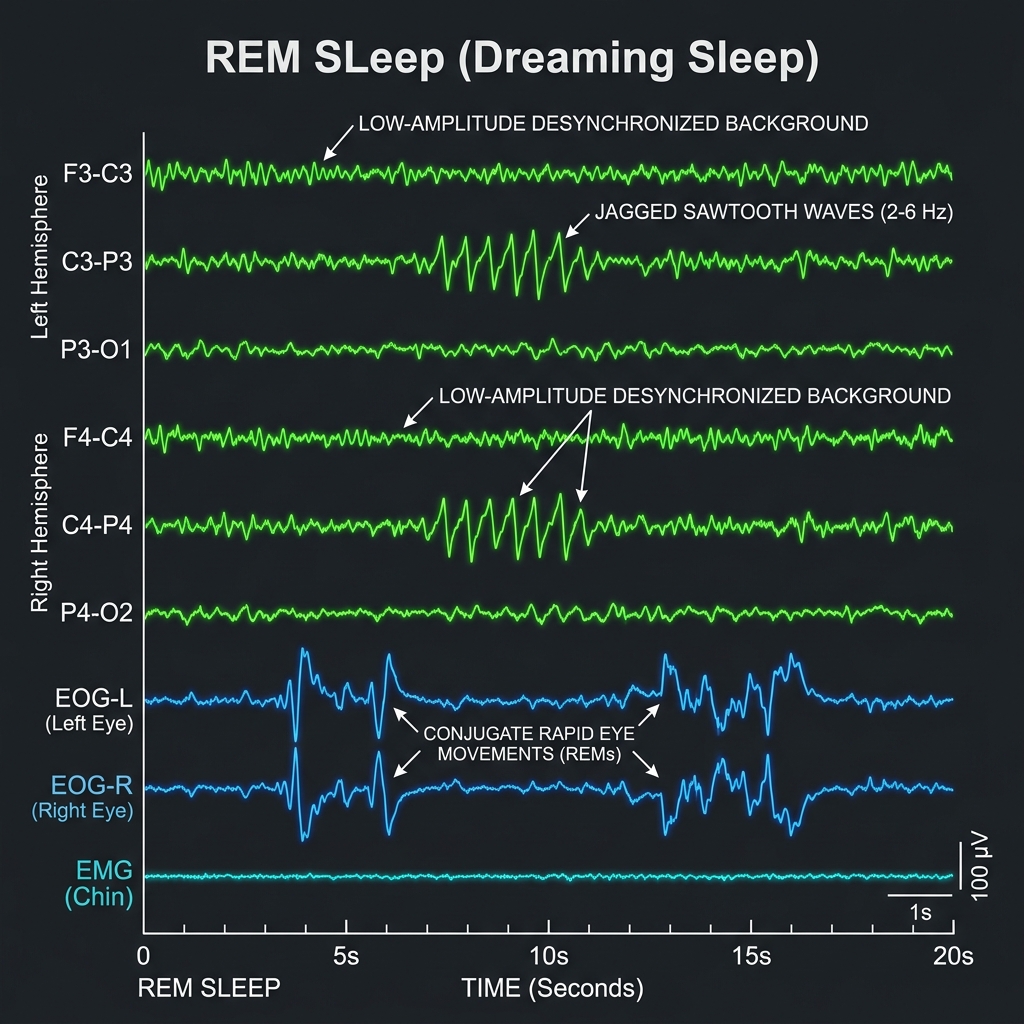
Stage REM (Dreaming State)
Low-voltage, mixed-frequency background resembling an active, awake state but with complete muscle atonia:
• Sawtooth Waves: 2–6 Hz triangular, jagged waveforms maximal in central channels, preceding rapid eye movements.
• Rapid Eye Movements (REMs): Sharp, irregular horizontal deflections.
Amplitude & Voltage Scales
Amplitude is the physical height of the wave in millimeters, which directly reflects the intrinsic voltage generated by the cortical dipoles, measured in microvolts (μV). Scalp recordings typically range from 10 to 100 μV.
Intracranial vs. Scalp Voltages: Active cortical cells generate millivolts of charge. However, because of the high electrical resistance of the CSF, skull, and skin, these signals are attenuated (diminished) by a factor of 10 to 100 times by the time they reach the scalp electrodes.
Physiological Variants: Differentiating the Lookalikes
One of the most common errors in clinical neurology is the misdiagnosis of normal, benign physiological variants as epilepsy spikes (false positives). Master these key benign variants to prevent clinical errors:
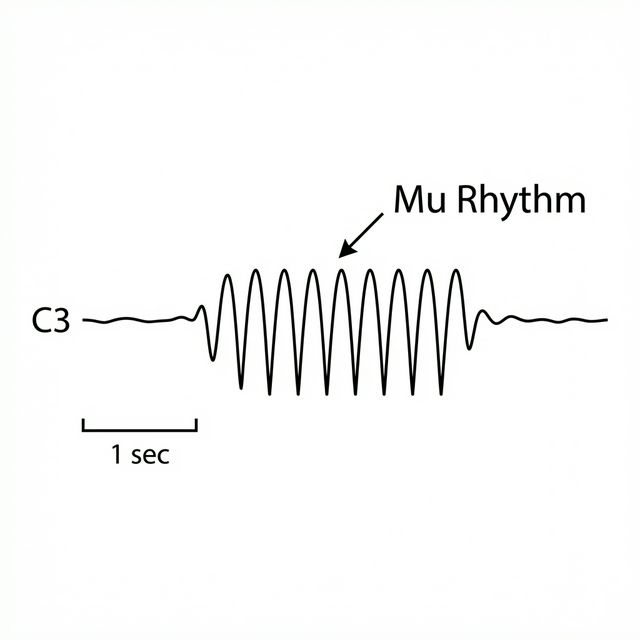
Mu Rhythm
Arch-shaped or comb-like 7–11 Hz central rhythm (C3/C4). Unlike Alpha, it has no reaction to eye opening. Differentiated because it blocks instantly upon motor movement (or even thinking about movement) of the contralateral hand.
Wicket Spikes
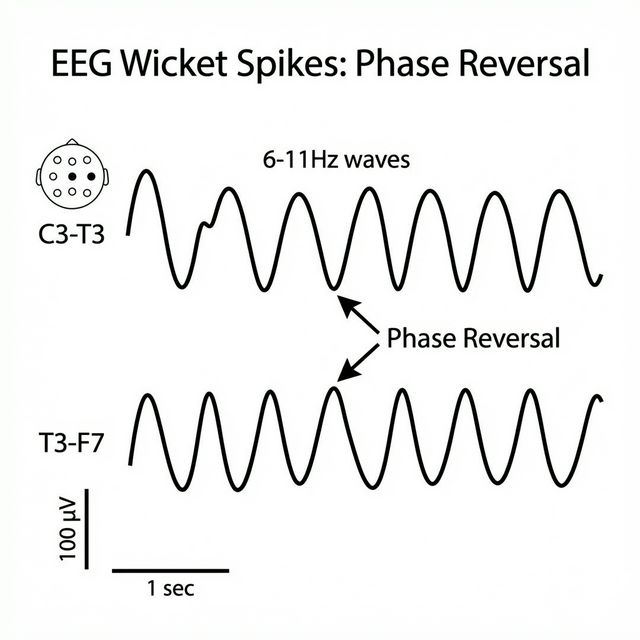
Highly sharp, comb-like 6–11 Hz runs, occurring in the temporal channels during drowsiness. Differentiated from epilepsy spikes because they are rhythmic, symmetric, have a smooth downslope, and lack any aftercoming slow wave.
BETS (SSS)
Benign Epileptiform Transients of Sleep (also known as Small Sharp Spikes / SSS). These are very brief (<50ms), low-amplitude (<50μV), monophasic or biphasic spikes occurring in N1/N2 NREM sleep. Differentiated because they have a broad, shallow dipole field across hemispheres, but absolutely no aftercoming slow wave disruption.
RMTD (Psychomotor Variant)
Rhythmic Mid-Temporal Drowsiness. Runs of monomorphic, flat-topped temporal theta waves (5–7 Hz) lasting several seconds during drowsiness. Differentiated from seizures because they remain completely monomorphic, do not evolve in frequency or spatial distribution, and cause no clinical deficits.
POSTs
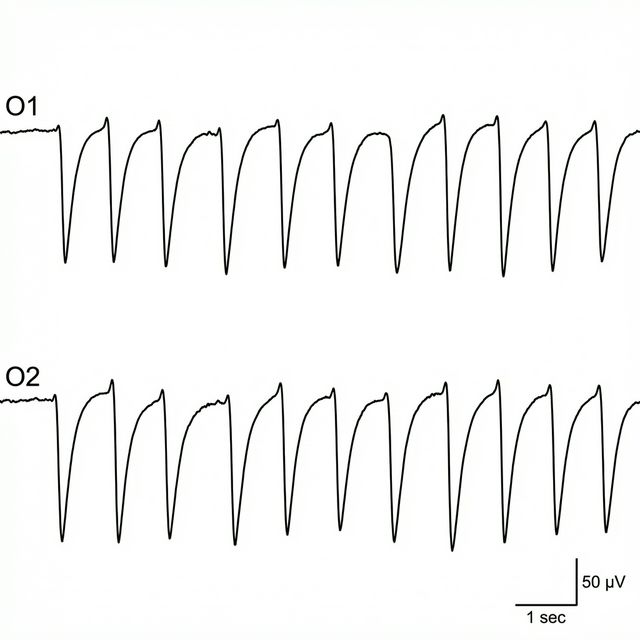
Positive Occipital Sharp Transients of Sleep. Sail-shaped, positive transients (deflecting DOWN in standard bipolar chains) maximal in occipital channels during N1/N2 sleep. Normal visual processing remnants.
Lambda Waves
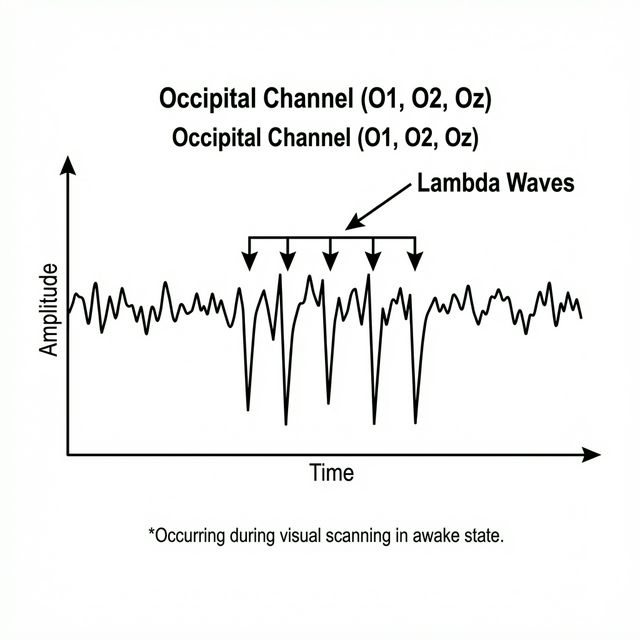
Occipital positive sharp transients occurring during active wakefulness when a patient is actively scanning a patterned environment (e.g., looking at ceiling tiles). Identical in shape to POSTS, but occurs awake with eyes open.
Activation Procedures
We perform specific activation procedures to stress the brain and induce diagnostic abnormalities:
Hyperventilation (HV)
3 minutes of deep, rapid breathing. Causes hypocapnia (reduced CO2) resulting in cerebral vasoconstriction and transient cortical hypoxia.
- Normal Response: "HV Buildup" consisting of high-voltage, rhythmic, generalized delta slowing (promoted by hypoglycemia).
- Abnormal Response: Induction of asymmetric focal slowing or generalized 3 Hz Spike-and-Wave discharges (classic absence seizure trigger).
Photic Stimulation
Flashing strobe light at progressive frequencies (1–30 Hz).
- Photic Driving (Normal): Occipital channels synchronize and match the flashing frequency.
- Photoparoxysmal Response (Abnormal): Strobe lights induce generalized, spike-and-wave discharges that outlast the flash duration, indicating photosensitive epilepsy.
Pathology Showcase: Diagnostic Signatures
Master these core diagnostic signatures of severe cerebral dysfunction and disease states:
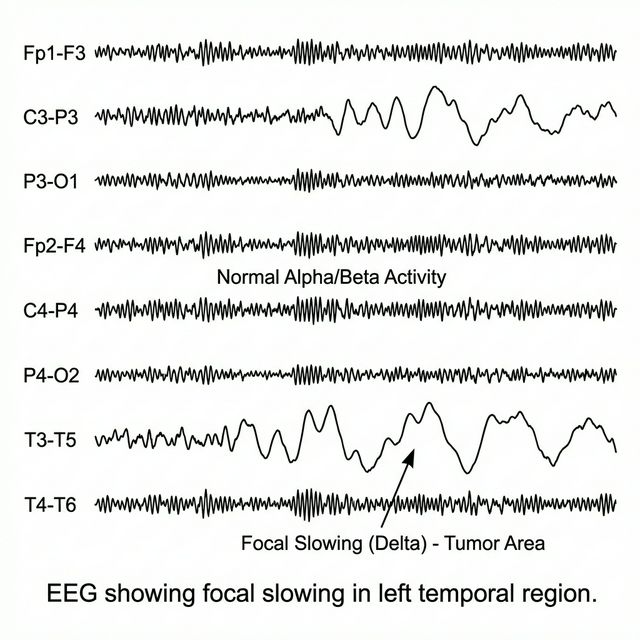
Focal Slowing (PDA): Continuous, polymorphic delta activity localized to a single hemisphere or lobe. Strong indicator of focal structural injury (e.g., tumor, stroke, abscess).
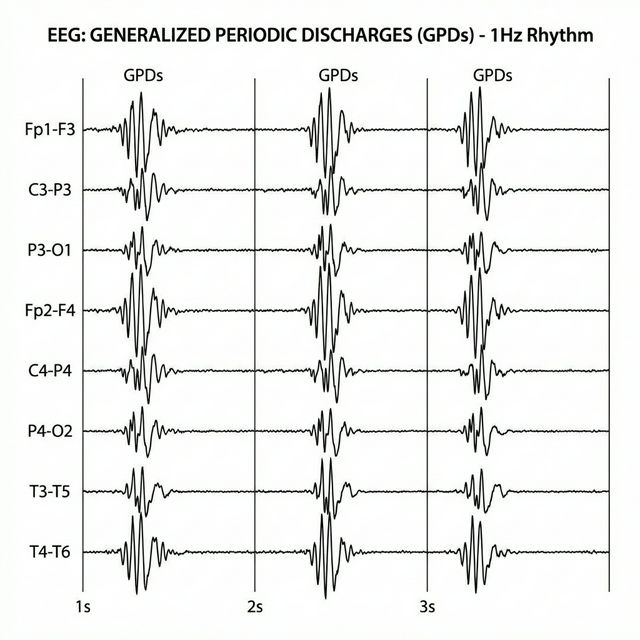
Generalized Periodic Discharges (GPDs): Standard periodic complexes occurring in a synchronized, generalized fashion. Associated with severe hypoxic-ischemic encephalopathy, drug toxicity, or Creutzfeldt-Jakob disease.
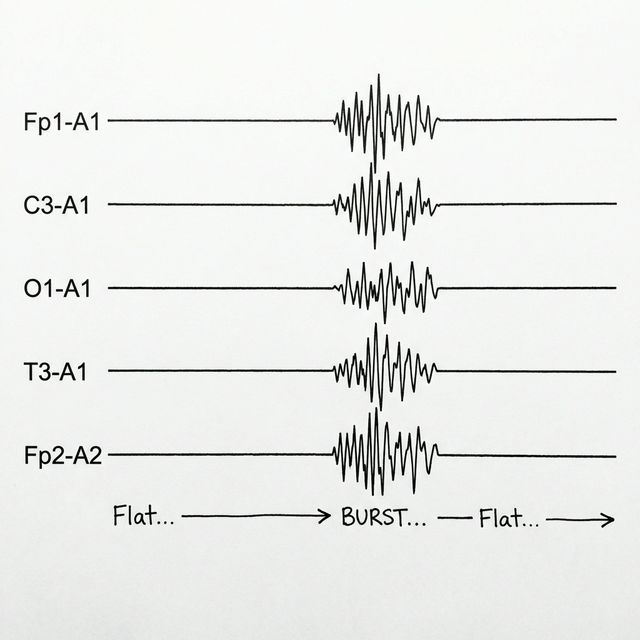
Burst Suppression: Alternating intervals of high-voltage mixed discharges (bursts) and periods of flat-line inactivity (suppression) under <10μV. Indicates profound coma, severe anoxia, or deep anesthesia.
Seizure Dynamics: The Ictal Evolution
Seizures are dynamic physiological events that evolve over time. Drag the slider to observe how a seizure discharge recruits cortical networks, changes frequency, and results in post-ictal depression.
Artifacts: The Biophysics of Noise
More than half of the transients recorded on an EEG are non-biological or extra-cerebral noise. Recognizing and filtering out these artifacts is crucial:
Eye Blinks (Bell's Phenomenon)
The eyeball behaves as a dipole: the cornea is relatively positive and the retina relatively negative. During a blink, the positive field is commonly maximal at Fp1/Fp2. In an Fp1–F3 derivation, Fp1 is Input 1; a relatively positive Input 1 produces a downward deflection when negative is displayed upward.
Lateral Eye Movements
Looking to the Left brings the positive left cornea close to F7 and the negative right retina close to F8.
Resulting Trace: An immediate positive/downward deflection at F7 and a simultaneous negative/upward deflection at F8. This is accompanied by rapid "lateral rectus spikes" (myogenic contractions) in the temporal leads.
Myogenic (EMG) Artifacts
Extremely high-frequency, narrow, jagged buzz caused by jaw clenching, chewing, or tension. Classically maximal in temporal channels (T7/T8). Oversmoothing with filters to remove this can artificially round the muscle spikes, causing them to look like cerebral Beta waves.
60Hz Line Hum
A regular fast artifact from mains interference, poor or unbalanced electrode contact, nearby equipment, or grounding problems. First inspect electrodes and the environment. A notch filter may reduce residual interference but can distort activity near the filtered frequency and should not replace troubleshooting.
Artifact Hunter: Clean the Trace
The signal below is unreadable due to muscle tension, mains hum, and eye movement. Use the clinical toggles below to filter the signal and recover the clean cerebral alpha rhythm.
Measure first. Place second.
Build a standard adult 10–20 array from reproducible cranial landmarks. This is a schematic training tool—not a substitute for supervised technologist training or local laboratory protocol.
Available Leads
Results
Montage Builder
Connect electrodes to build your own EEG channels. Click two electrodes to create a bipolar pair.
Active Channels
Connect leads on the head
Lead Placement Quiz
Click "Start Quiz" to begin testing your knowledge of lead placement.