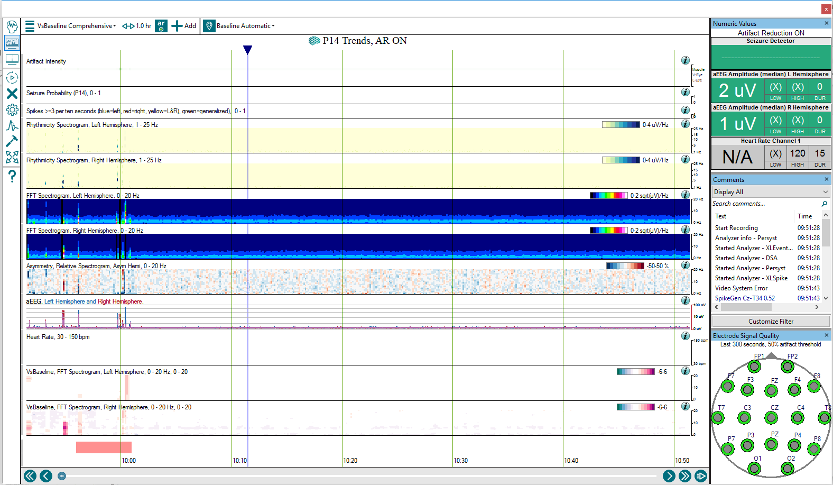
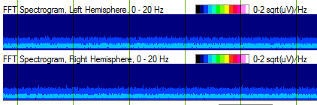
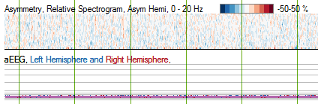
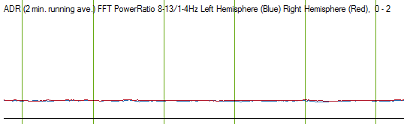
The small panels below are generated teaching sketches in the style of a qEEG display, not screenshots. Check the color scales and settings on your own system.
Power spectrogram (CDSA, FFT)
Shows time across, frequency up (usually 0–20 Hz), power as color: warm is more power, cool is less. One strip per hemisphere.
Look for a sudden rise in power standing out from the background. Seizures often make a flame shape; sleep shows a spindle band near 12–14 Hz.
Watch out: color is relative to the scale chosen, and artifact adds power just as seizures do.
Rhythmicity spectrogram
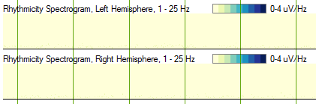
Shows only the power that belongs to rhythmic, repeating activity (a Persyst trend). Pale is non-rhythmic; blue is strongly rhythmic.
Look for a band of rhythmicity that appears and drifts in frequency, as most seizures do.
Watch out: periodic discharges, rhythmic artifact (chewing, patting, ventilator) and sleep spindles are rhythmic too.
aEEG and suppression percentage
aEEG is amplitude after filtering and smoothing, plotted as upper and lower margins on a semi-logarithmic scale (linear to 10 µV, logarithmic above).
Look for the lower margin rising during a seizure, and dropping toward zero in burst suppression.
Suppression % is the share of each epoch below a small voltage threshold: about 0% for a continuous background, 50–99% in burst suppression.
Asymmetry spectrogram
Shows the difference in power between homologous left and right electrodes at each frequency. By convention blue is more power on the left and red more on the right.
Look for a focal seizure lighting up one side, then the opposite color as postictal suppression follows.
Watch out: a skull defect, scalp edema or one bad electrode makes a persistent asymmetry.
Alpha/delta ratio and alpha variability
Shows alpha power divided by delta power per region, trended over days. Relative alpha variability grades how much alpha fluctuates.
Look for a sustained regional fall after subarachnoid hemorrhage. A post-stimulation ADR falling more than 10% for six consecutive readings, or more than 50% once, was associated with delayed cerebral ischemia (Claassen 2004).
Watch out: sedation, sleep and artifact move it too; compare with the patient's own baseline.
Seizure detections
Shows where an algorithm judged a seizure likely.
Look for clusters of detections that line up with flames and rhythmicity.
Watch out: detectors miss low-amplitude, slow and focal seizures and seizures within periodic patterns, and alarm on artifact. Treat each detection as a prompt to read the raw EEG.